Inspecting Values in the Debugger
To inspect the value of an item
-
Specify the selected item, by performing one of the following actions.
-
Click on the item in the method source window, and then click the Inspect toolbar button or press Ctrl+I.
The Inspector form is then displayed; that is, the Variable Inspector dialog is not displayed first.
-
Select the Inspect command from the Variables menu.
-
Click the Inspect toolbar button.
-
Press Ctrl+I.
The dialog shown in the following image is then displayed, to enable you to specify the name of the entity you want to inspect (that is, the expression or watch name).
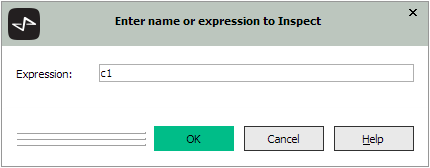
This dialog is displayed when the caret in the editor pane is not positioned on a variable; for example, it is positioned on an empty line. If the caret is positioned on a local variable or parameter, the value of the selected variable is displayed directly; that is, the Inspect dialog is not displayed.
The dialog accepts either the name of a local variable or parameter or an expression that is compiled and executed. There are no restrictions other than the expression is able to be compiled and returns a value. It is your responsibility for the effects that the expression may have on the database and execution of the method logic.
-
-
In the Expression text box, specify the item to be inspected.
-
Click the OK button.
You can also display the bubble help containing the current value of a local variable in a line of code in the Method Source window, by positioning the cursor over the local variable whose value you want displayed.
For details about the circumstances under which bubble help is displayed by default, see "Displaying Code in the Method Source Window", earlier in this chapter.
If the item being inspected contains a primitive type, an invalid object reference, or a null object reference, the Variable Inspector dialog, shown in the following image, is displayed.
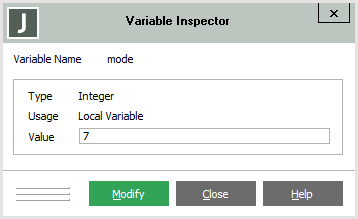
The name of the item on which the caret is positioned in the Method Source window is displayed and the primitive type, usage, and the current value are displayed in the group box.
You can resize the dialog or scroll the Value text box to view a long string or binary value, if required. The Value text box is resized as the dialog is resized.
The Value text box and Modify button are disabled if the variable cannot be modified; that is, it is an Any primitive type.
To modify the value of the variable associated with the current method that is executing in the debugger
-
In the Value text box, specify the new value for the selected primitive type variable.
The type of value that you specify must be the same as that of the selected value; for example, you cannot change the value of a numeric variable to a string value.
-
Click the Modify button.
The Value text box and the Modify button are enabled only if it is valid to change the variable value.
If the item contains an object reference, an Inspector form is opened for the object when you click the OK button in the Inspect Variable dialog.
For details about:
-
Modifying values, see "Modifying Values in the Debugger", elsewhere in this chapter
-
Using the Object Inspector, see "Using the Inspector Form", in Chapter 6