Maintaining Debugger Breakpoints from the Editor Pane
The Jade Platform development environment provides functionality for setting and maintaining debugger breakpoints from the editor pane, as follows.
-
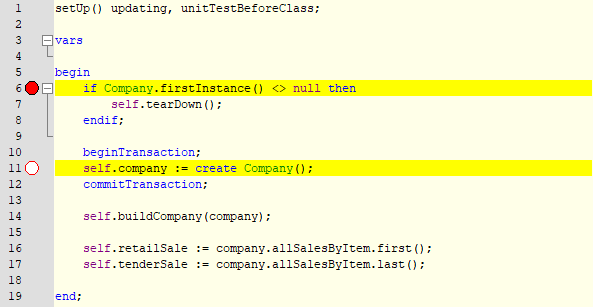
If the line number display or folding is enabled in the editor pane for a Jade method, a column is added to the display in the left margin after the line number and before the folding margin; for example:
-
When an enabled breakpoint is set on a line, a red circle is displayed in the breakpoint margin. Clicking on an enabled breakpoint (indicated by a red circle) removes the breakpoint.
-
When a disabled breakpoint is set on a line, a white circle is displayed in the breakpoint margin. Clicking on a disabled breakpoint (indicated by a white circle) enables the breakpoint.
-
Clicking on an empty breakpoint margin for a line sets a breakpoint.
-
Right‑clicking in the breakpoint margin displays a breakpoint menu that has the following commands.
-
Clear All Breakpoints From Method.
-
Breakpoint Options, which initiates the Breakpoint Options dialog that allows you to disable or enable a breakpoint, set a pass count, and set a conditional expression for the breakpoint. For details, see "Using Conditional Breakpoints and Pass Counts", in Chapter 7.
The Breakpoint Options dialog provides a large Condition control that allows for multiple‑line input and AutoComplete functionality. The dialog can also be resized.
-
Disable or Enable, which toggles the disabled or enabled status of the current breakpoint.
-
Remove Breakpoint.
The Disable Breakpoint or Enable Breakpoint and the Breakpoint Options commands are disabled if the method has been changed and not compiled or if there is no breakpoint on that line.
-
-
Hovering the mouse over a breakpoint indicator displays a bubble help window with the breakpoint details; for example, Disabled breakpoint.
-
The Jade Platform development environment editor pane right‑click breakpoints menu includes the ability to invoke the Breakpoint Options dialog and to clear all breakpoints.
A breakpoint always shows an icon in the breakpoint column of the user method in the development environment editor pane and the Jade Debugger method source window.
The Preferences dialog Editor Options sheet now provides the Highlight entire source line for breakpoints check box that controls whether the display of a breakpoint highlights the whole source line for a breakpoint. (This check box is checked by default.)
2022.0.01 and higher