Using Watches in the Debugger
Watches are useful when you need to monitor or detect changes to parameters and local variables used in your methods. The Watches window displays the values of items that are being watched.
A path can be used as a debugger watch expression, but a path that contains a method call cannot be inspected.
Although the debugger accepts expressions as watches, they are limited to 100 characters (stored in an identifier array where the key is a maximum of 100 characters). The debugger accepts only the initial entry of a new watch expression if it successfully compiles, executes, and returns a value. To enter a new watch, therefore, the debugger must be at a break position where the expression is valid and the objects involved are not null.
When the watch is active, if it is not valid in another context, the value is displayed as [Out of scope]. If the expression cannot be executed because a variable is null, **not Initialised** is displayed.
It is your responsibility for the effects that the expression may have on the database and execution of the method logic.
As your code executes, the values of the items change, and the Watches window is updated.
To display the Watches window if it is not already displayed
-
Select the View menu Watches command.
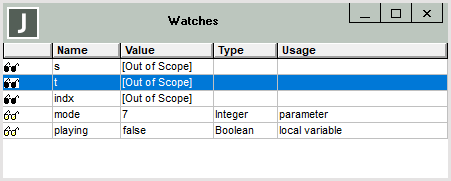
The following image shows an example of the Watches window.
For each item being watched, the name and value of the item are displayed. The value that is displayed is:
-
The current value of the item, if the item is a primitive type
-
An oid, if the item contains an object reference
-
<null>, if the variable has no value assigned to it
-
[Out of scope], if the item is not within the scope of the method currently selected in the Call Stack window or it is declared but not used in the method currently selected in the Call Stack window
-
**not initialised**, if the expression cannot be executed because a variable is null
By default, the variables in the Watches window are displayed in the order in which they are added to the window. You can sort the table of displayed watches by clicking on the fixed column cell of the table. Clicking in the fixed part or a column causes the entries to be displayed alphabetically sorted (case‑insensitive) by that column for the rest of the debugger session. For example, clicking on an identifier in the Name column sorts the list by identifier name. Clicking the sorted fixed column cell again inverts the sorted list.
If the table is sorted, a numeric sorting indicator is displayed in the fixed cell of the column. If the column selected for sorting is not the identifier column, the identifier column is the second sort key.
Values being watched are highlighted when they change.
Position the cursor over an object or variable in a line of code in the Method Source window to display the current value of that item in bubble help. (For details about the circumstances under which bubble help is displayed by default, see "Displaying Code in the Method Source Window", earlier in this chapter.)


