Starting an Application in Debug Mode
The Jade Platform development environment includes a debugger that enables you to analyze how your application behaves. Debugger features include the following.
-
Stepping through code
-
Setting breakpoints in code
-
Monitoring and changing the values of variables used in the code
-
Displaying call stack information
The Jade Debugger can be activated when you initiate your Jade application.
To debug all or part of a Workspace, the current method in the JadeScript class, or unit test independently of your application, press Shift+F9. Alternatively, select the Jade menu Debug command. (The Unit Test Debug command replaces the Debug command in the Jade menu when the Jade unit test framework is active.)
To debug a non-GUI application (for example, a server application initiated when the application server is started in Jade thin client mode), you must first change the application type to GUI, No Forms, by using the Application Type combo box in the Application sheet of the Define Application dialog.
When debugging a method created from a Workspace, the debug execution initially stops on the first line of execution. Use the Jade debugger to set debug breakpoints in the method. You can then step through the logic or debug and run it to meet your requirements.
To activate the Jade debugger
-
Click the Run Application toolbar button. (Alternatively, select the Application menu Run command from the Application Browser for your selected application.)
The Run Application dialog is then displayed.
-
Check the Activate Debugger check box in the Run Application dialog.
Alternatively, you can check the Run in Debug Ready Mode check box in the Run Application dialog if you want to run the application in debug mode but without the Jade Debugger being initiated when this is checked. Attaching to that application then allows debugging of any method already on the execution stack. If the application is idle and no modal dialogs are displayed, attaching the Jade debugger is equivalent to running in debug‑ready mode. (For details, see "
The Debug window, shown in the following image, is then displayed.
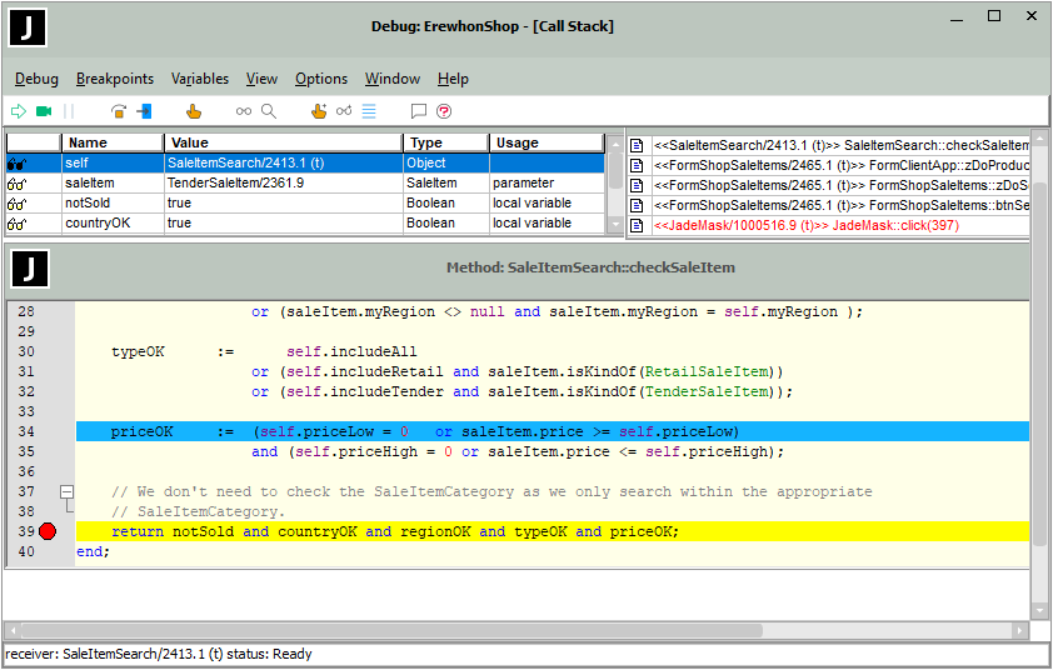
By default, the line of the source code that is currently executing is highlighted in a color of your choice or the default color, and the lines on which breakpoints are set are highlighted. You can change the display colors in the Editor sheet from the Preferences dialog (accessed from the Options menu Preferences command), by using the Debug Step Line or Debug Line color option, respectively.
The Save settings on exit check box in the Debugger Options dialog (accessed by selecting the Preferences command from the Options menu) enables you to save the size and position of windows that you resize or reposition.
If you have repositioned or resized windows within the main window and you want to return to the default layout, select the Restore Default Layout command in the View menu. This command is disabled if the windows are already in the default layout positions. In the default layout mode, resizing the Debug window retains the relative default layouts of the three windows. The current left, top, width, and height of the Debug window are retained.
The Debug window contains:
-
A menu bar
-
A row of toolbar (command) buttons
-
A method source window, displaying the source code for the method that is currently executing
-
A Local Variables window
-
A Call Stack window
To enable you to debug packages and peer schemas, watches and breakpoints are visible across schemas.