Displaying All Breakpoints
The Breakpoints window lists all breakpoints that are set.
To show all breakpoints, perform one of the following actions
-
Select the Show All BreakPoints command from the Breakpoints menu
-
Click the Show all breakpoints toolbar button
The Breakpoints window in the Jade Debugger shows all breakpoints in all schemas. The Breakpoints window in the Jade Platform development environment shows all breakpoints in the current schema.
The Breakpoints window, shown in the following image, is then displayed.
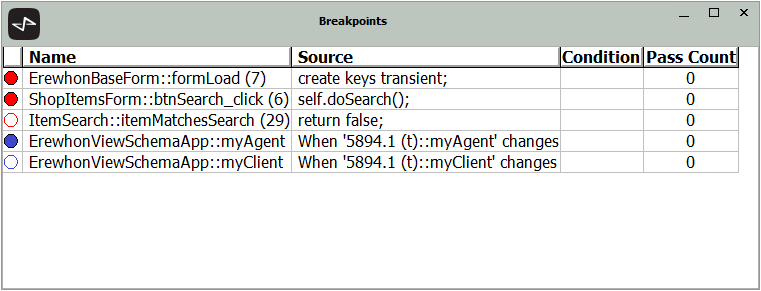
The Breakpoints window includes:
-
An indicator that shows whether the breakpoint is enabled (a filled circle) or disabled (an empty circle).
-
The method name and line number for the breakpoint.
-
"When 'oid<lifetime>::property-name' changes"
The lifetime value is "(t)" for transient, "(s)" for shared transient, or "(p)" for persistent
-
A condition to determine if execution halts at the breakpoint.
-
A pass count of the number of times the breakpoint is passed before execution is halted.