Web Service Application
In the current release, there is no programmatic interface to obtain statistical information relating to a Web service application. Such information can be obtained by logging the Web application monitor output. The JADE Monitor has information relating to the Web service processes. An example of this is shown in the following image.
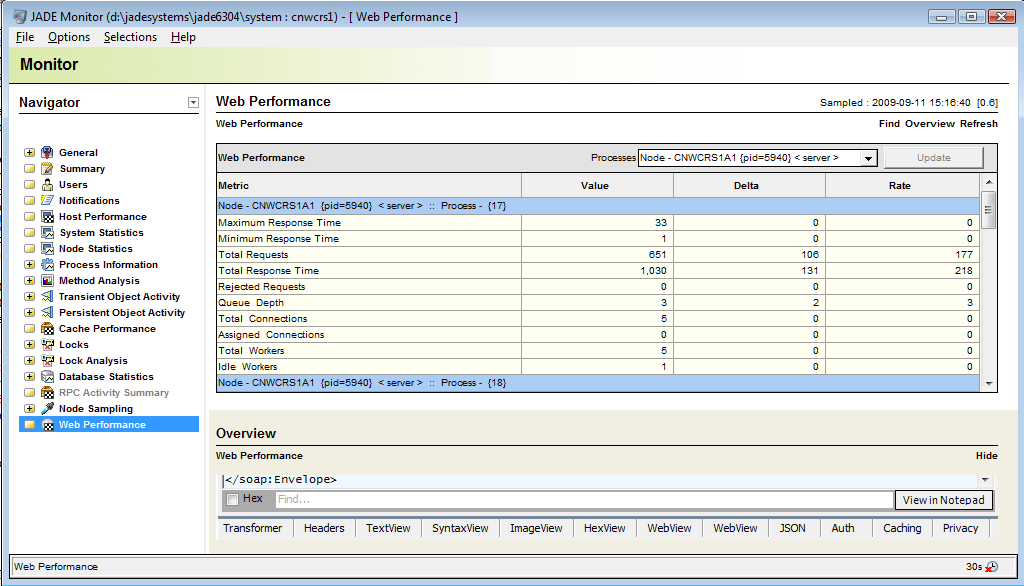
The Web service information that is monitored is listed in the following table.
|
Row Name |
Description |
|---|---|
|
Maximum Response Time |
Maximum time in ms. for a message response |
|
Minimum Response Time |
Fastest response time in ms. for a message response |
|
Total Requests |
Total requests |
|
Total Response Time |
Total response time |
|
Rejected Requests |
Number of requests rejected (no available connections) |
|
Queue Depth |
Number of requests in the queue |
|
Total Connections |
Number of total connections |
|
Assigned Connections |
Number of connections currently in use |
|
Total Workers |
Number of application copies |
|
Idle Workers |
Number of applications that are idle |