IIS
This section refers only to the use of IIS 7. For other releases, consult the appropriate documentation.
Logging can be enabled using the IIS Manager from the MMC console. From here, we can get to the logging options window by selecting Default Web Site and then selecting Logging, which displays the window shown in the following image.
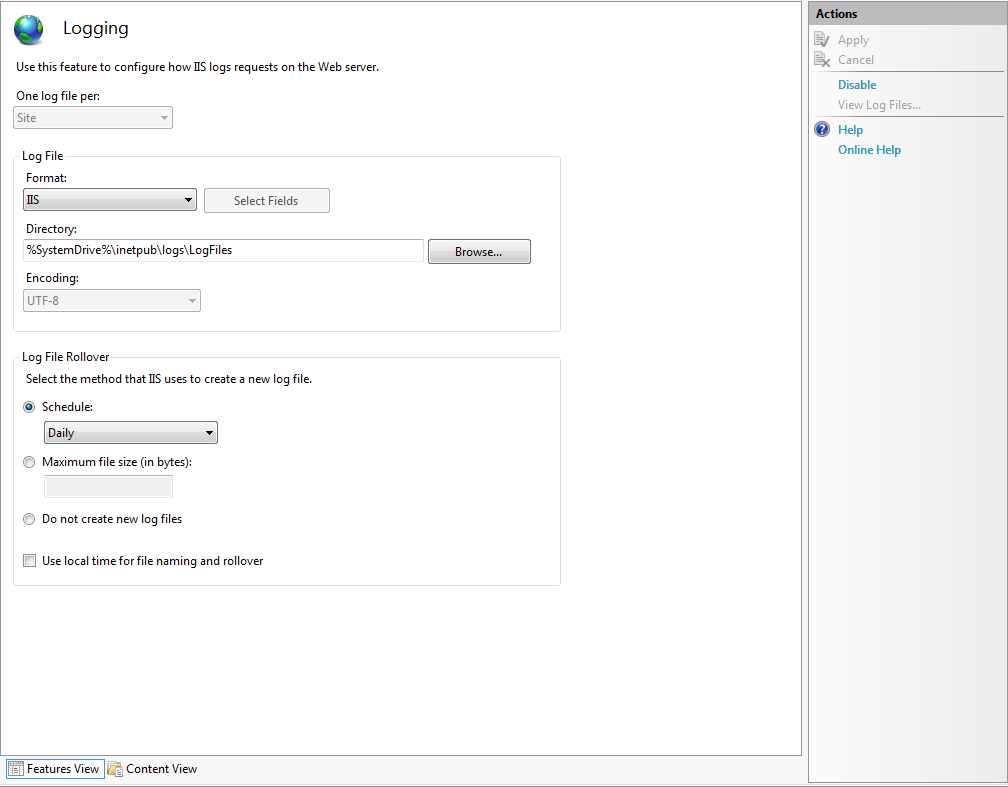
Set up options to meet your requirements. IIS format for the log file provides the most information. Make sure that logging is enabled (the Actions window will show Disable, if it is).
Making requests to your Web service will now log information similar to that shown in the following image.
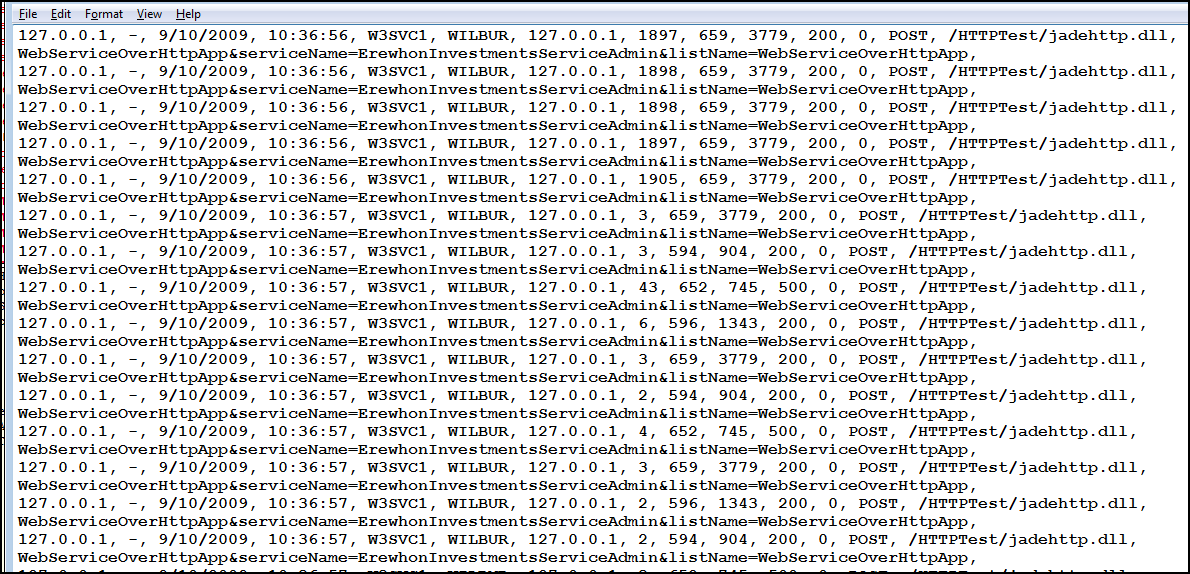
The example in the above image is in IIS format. The IIS log file format is a fixed ASCII text‑based format, so you cannot customize it.
The IIS log file format records the following data.
-
Client IP address
-
User name
-
Date
-
Time
-
Service and instance
-
Server name
-
Server IP address
-
Time taken
-
Client bytes sent
-
Server bytes sent
-
Service status code (a value of 200 indicates that the request was fulfilled successfully)
-
Windows status code (a value of 0 indicates that the request was fulfilled successfully)
-
Request type
-
Target of operation
-
Parameters (the parameters that are passed to a script)
Not all fields will contain information. For fields for which there is no information, a hyphen (-) is displayed as a placeholder. If a field contains a non‑printable character, it is replaced with a plus sign (+), to preserve the log file format. This typically occurs with virus attacks, when, for example, a malicious user sends carriage returns and line feeds that, if not replaced with the plus sign (+), would break the log file format.
The information provided by a single entry from the output displayed in the previous image, as follows, is listed in the following table.
127.0.0.1, -, 9/10/2009, 10:36:56, W3SVC1, WILBUR, 127.0.0.1, 1897, 659, 3779, 200, 0, POST, /HTTPTest/jadehttp.dll, WebServiceOverHttpApp&serviceName=ErewhonInvestmentsServiceAdmin&listName=WebServiceOverHttpApp,
|
Field |
Appears As |
Description |
|---|---|---|
|
Client IP address |
127.0.0.1 |
The IP address of the client. |
|
User name |
- |
The user is anonymous. |
|
Date |
9/10/2009 |
This log file entry was made on September 10, 2009. |
|
Time |
10:36:56 |
This log file entry was recorded at 10:36 A.M. |
|
Service and instance |
W3SVC1 |
This is a Web site, and the site instance is 1. |
|
Server name |
WILBUR |
The name of the server. |
|
Server IP |
127.0.0.1 |
The IP address of the server. |
|
Time taken |
1897 |
This action took 1,897 milliseconds. |
|
Client bytes sent |
659 |
The number of bytes sent from the client to the server. |
|
Server bytes sent |
3779 |
The number of bytes sent from the server to the client. |
|
Service status code |
200 |
The request was fulfilled successfully. |
|
Windows status code |
0 |
The request was fulfilled successfully. |
|
Request type |
POST |
The user issued a POST command. |
|
Target of operation |
/HTTPTest/jadehttp.dll |
The user wants to connect to jadehttp. |
|
Parameters |
WebServiceOver ….. |
Parameters passed. |
You can use a free Log Parser tool provided by Microsoft to analyze the IIS logs. Log Parser is a powerful, versatile tool that provides universal query access to text‑based data.