Overview
When you run an HTML-enabled application, the JADE Web Application Monitor is automatically initiated on the client node workstation on which the HTML-enabled JADE application is running.
If a client node has more than one active HTML-enabled application, a Web Application Monitor window is displayed for each active application on that workstation.
Use the Web Application Monitor to view the status of Web sessions, open your default browser for Web services applications, and to reset or close Web sessions.
When the Web Application Monitor is initiated, the window displays session sign on information, including:
-
Internet protocol (IP) address
-
Session id
-
Query string
The Web Application Monitor menu bar contains the menus listed in the following table.
| Menu | Description |
|---|---|
| File | Administers your HTML-enabled application |
| View | Controls the display of information in your Web Application Monitor window |
| Session | Controls your Web session |
| Help | Accesses the standard Common User Access (CUA) help options |
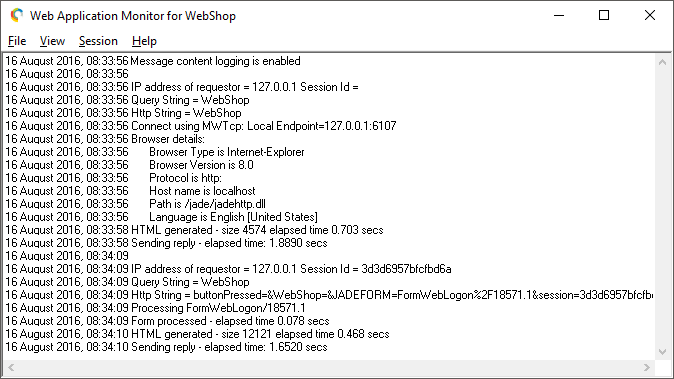
The Web Application Monitor window is a multiple-line text window that logs and displays Web session information. Information is appended to the window display with each user request and new session interaction, as shown in the following image.
You can change the font name and size for the Web Application Monitor window by using the Editor sheet of the Preferences dialog, accessed from the Preferences command in the Options menu of browse windows in the development environment.
Use the scroll bar to scroll up and down the displayed HTML thin client information, if required.
When you exit from the HTML-enabled application, the Web Application Monitor window is closed, and all displayed information is purged.
For details about running the JADE Monitor that provides system instrumentation and diagnosis, see Chapter 2, "