Displaying All Breakpoints in the Current Schema
The Breakpoints window lists all breakpoints that are set in the current schema.
To show all breakpoints in the current schema, perform one of the following actions
-
Select the Show All BreakPoints command from the Breakpoints menu
-
Click the Show all breakpoints toolbar button
The Breakpoints window, shown in the following image, is then displayed.
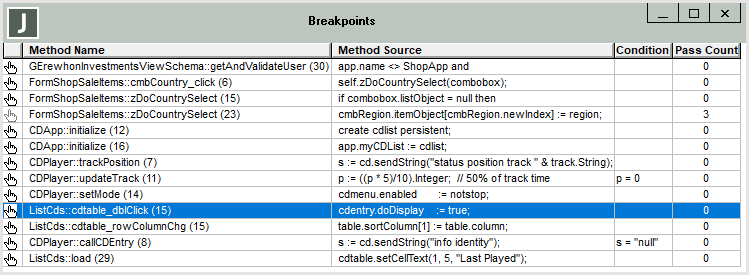
The columns in the Breakpoints window are automatically sized. The Breakpoints window is restored to its previous position and size if the Save settings on exit check box on the Debugger Options dialog is checked, but any previous column widths are no longer restored.
When the debugger is at a breakpoint, if nothing is selected and you hover the mouse over a variable, the value of the variable is displayed when possible (including path expressions). No methods are executed.
If an expression is selected, hovering over the selection attempts to execute the expression. The expression must be compilable within the context of the method and must return a value.
If the compile and execution succeed, the returned value is displayed.
It is your responsibility for the effects that the expression may have on the database and execution of the method logic.