Displaying Process Method Cache Statistics
To display method cache statistics for a selected process or for all processes in a node
-
Select the Users activity in the in the Navigator pane. The Users view is then displayed.
-
Right-click on the node in the first row of the table, or on a process in the node.
-
Select the Method Cache Statistics command from the popup menu that is displayed.
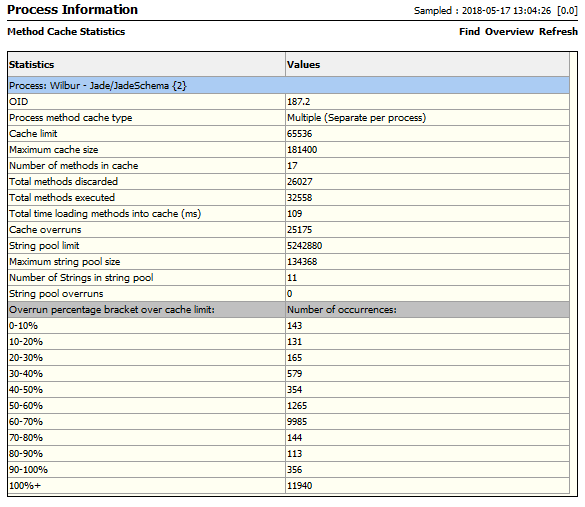
The Method Cache Statistics table is then displayed in the Process Information view.
If the method cache is overrun (for example, you have set it to a low limit such as 64K in the [JadeInterpreter] section of the JADE initialization file), an additional Overrun percentage bracket over cache limit table is displayed under the cache statistics for each process, as shown in the following image.
2018.0.01 and higher