Setting Up the JADE Monitor
When you first access a JADE Monitor, set it up to meet your own requirements. Alternatively, you can maintain user preferences for the current JADE Monitor work session.
To set up the JADE Monitor or maintain your user preferences
-
Expand the General activity group in the Navigator pane at the left of the JADE Monitor window and then select the Monitor Setup activity. (Alternatively, you can click the down‑arrow icon at the upper-right of the Navigator pane, to expand all collapsed activity groups and then select the Monitor Setup activity.)
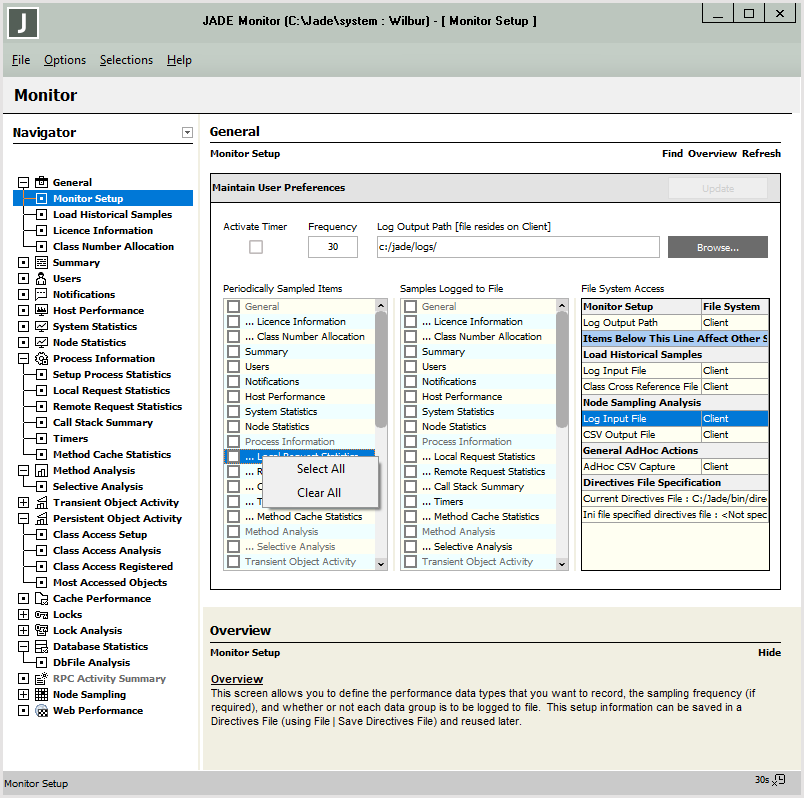
The Monitor Setup view of the General activity group is then displayed at the right of the window.
-
If you want to activate the timer, check the Activate Timer check box. Alternatively, click the clock icon at the right of the status line. The cross symbol is then removed from the clock icon, indicating that the timer is active.
When the timer is active, activities that are selected for sampling are displayed in a red font in the Navigator pane.
-
If you want to change the frequency of sampling, enter the number of seconds in the Frequency text box (for example, if you want sampling to occur at 45 seconds intervals rather than the default 30 seconds interval).
The maximum time interval is 32,400 seconds, or nine hours.
The number of seconds that you specify in this text box is displayed in parentheses after the Timer Interval command in the Options menu.
-
If you want to change the path and directory to which sampling files are logged, enter the value in the Log Output Path text box. (For details of the type and location of this file, see the discussion in the knowledge base article at the lower right of the window.) Alternatively, click the Browse button and select the path and directory in the common Browse For Folder dialog that is then displayed.
For details about the default log file location, see "Log File Location", earlier in this chapter.
-
In the Periodically Sampled Items list, check the check box at the left of each item that you want sampled periodically.
Alternatively, if you want to select all items or clear all selected items from periodic samples, right-click in this list (or press Shift+F10) and select the respective Select All or Clear All command from the popup menu that is then displayed. (For details, see "Selecting All Items or Clearing the Selection of All Items in a List", later in this chapter.)
-
In the Samples Logged to File list, check the check box at the left of each item whose samples you want logged to the file specified in the Log Output Path text box. (For details about toggling the logging of sampled activities to a file, see "Logging a Sample to a File", in Chapter 2.)
Alternatively, if you want to select all items or clear all selected items from samples, right-click in this list (or press Shift+F10) and select the respective Select All or Clear All command from the popup menu that is then displayed. (For details, see "Selecting All Items or Clearing the Selection of All Items in a List", later in this chapter.)
You can set up a JADE Monitor session to periodically sample specified performance metrics, with the option of writing any or all of the sampled metrics to a file (to a log file for future playback in another JADE Monitor session or to a CSV file for use in an external program). For details, see "Logging a Sample to a File" or "Starting or Stopping the Capture of Data to a CSV File", in Chapter 2.
-
In the File System Access table, click the row of the File System column whose file system you want to change and then select the Server value in the drop-down list if you want to change the file system from the default Client value or the Client value if you want to change the System file system back to the client.
As the log output path applies only to the client system, there is no drop-down list in the Log Output Path row in the File System column.
-
Click the Update button, to save your preferences.
If you have changed any of the controls in the Monitor Setup view and you click Refresh at the upper right of the window (or you press F5) before you click the Update button, your changes are abandoned.
The following image shows an example of the Monitor Setup view in the General activity group.
If you want to save your user preferences to a directives file so that you can use the same preferences for subsequent JADE Monitor work sessions, select the Save Directives or Save Directives As command from the File menu. For details, see "Saving Directives" or "Saving the Directives File as another Name", in Chapter 2.