The Local Variables window enables you to monitor or detect changes to parameters and local variables used in your methods.
To display the Local Variables window if it is not already displayed
Select the View menu Local Variables command.
As the Local Variables window automatically monitors all parameters and local variables in your methods, you do not have to access the Watch Variable dialog to specify each variable that you want to watch in the Watches window.
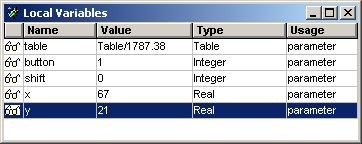
The Local Variables window, shown in the following diagram, displays the values of all local variables in your methods. As your code executes, the values of the items change and the Local Variables window is updated. Local variables being watched are highlighted when values change.
For each local variable being watched, the name and value of the item are displayed. The value that is displayed is:
The current value of the variable, if the item is a primitive type
An oid, if the variable contains an object reference
<null>, if the variable has no value assigned to it
[Out of scope], if the variable is not within the scope of the method currently selected in the Call Stack window, or it is declared but not used in the method currently selected in the Call Stack window
Local variable values being watched are highlighted when they change.
Position the cursor over a local variable in a line of code in the Method Source window to display the current value of that item in bubble help. (For details about the circumstances under which bubble help is displayed by default, see "Displaying Code in the Method Source Window", earlier in this chapter.)
To select a method, view the Call Stack window (by selecting the Call Stack command from the View menu), and then select one of the methods in the list.
As the methods are selected, the Local Variables list is updated to reflect the values that are within the scope of the selected method. If no method is selected, the values are displayed for the method that is currently executing.
You can watch:
Method parameters
Local variables
You can inspect or modify variables selected in the Local Variables window. For details, see "Inspecting Values Using the Debugger" and "Modifying a Value Using the Debugger", later in this chapter.