The Debug button displays a Call Stack Browser. The Call Stack Browser enables you to browse methods in the call stack, and inspect parameters and local variables.
The Call Stack Browser is also displayed when you call the
The exception, including the method call stack history and the exception stack history, is also written to the log file of the current application (for example, MyApp.log). The exception stack history section contains at least the error code of each of the nested exceptions.
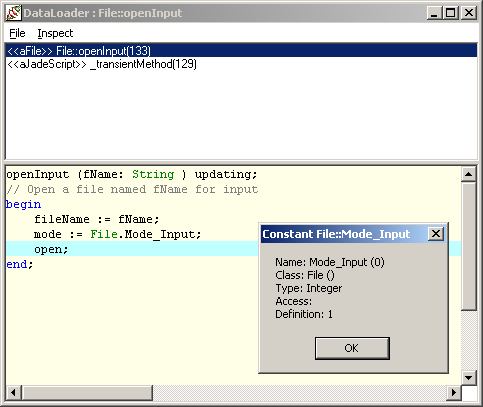
The following diagram shows an example of the Call Stack Browser, with the
Use the Inspect Item command from the Inspect menu to display the value of a primitive item or to inspect an item containing an object reference.
To inspect the value of the item on which the caret is positioned
Perform one of the following actions.
Select the Inspect Item command from the Inspect menu
Press CTRL+I
If the item being inspected contains a primitive type, an invalid object reference, or a null object reference, a dialog is then displayed. (An example of this dialog is shown in the previous diagram.)
If the item contains an object reference, an Inspector window for the object is then displayed. The selected object, and any properties defined for that object, is displayed in the left of the Inspector window.
To view the values in the Inspector window for the displayed properties
Click on the required property.
The values for the property are then displayed in the pane at the right of the window.
For more details, see Chapter 7 of the JADE Development Environment User’s Guide, "
To exit from the Call Stack Browser
Select the Exit command from the File menu.
The Call Stack Browser is then closed, and focus returns to the Unhandled Exception dialog.